2(2018), 2, 77-86

Feminist Research

2582-3809

Data and Techniques Used for Analysis of Women Authorship in STEMM: A Review

Vijay Bhagat 1

1.Post-graduate Research Centre in Geography, Agasti Arts, Commerce and Dadasaheb Rupwate Science College, Akole-422601, Ahmednagar, Maharashtra (India).

Dr.Vijay Bhagat*

*.Post-graduate Research Centre in Geography, Agasti Arts, Commerce and Dadasaheb Rupwate Science College, Akole-422601, Ahmednagar, Maharashtra (India).

Professor.Souad Slaoui 1

1.Department of English , Sidi Mohammed Ben Abdellah University , Morocco.

02-10-2019
24-06-2019
10-09-2019
16-09-2019

Graphical Abstract

Highlights

  1. Women are underrepresented in authorship of scholarly articles published in STEMM.
  2. Scholars have analysed representation of women using different data and techniques.
  3. The applicability of the results is limited to used data and techniques.
  4. Upcoming studies should adopt more inclusive approach.
  5. The field is new, active, important and challenging area of research for gender equality and social welfare.

Abstract

Women are underrepresented in authorship of scholarly articles published in Science, Technology, Engineering, Mathematics and Medicine (STEMM). The scholars have been analysed this representation of women using wide range of data, methods and techniques. Several studies have reported complementary results with gender disparity in authorship of scholarly publications. However, the reported results vary according to objectives of the study, size and source of the data, techniques and methods used for the analysis. Therefore, these results are specific to size and source of data, techniques and methods, academic fields, journals, regions, etc. and insufficient to reach global conclusions. The study concludes that: 1) available data is insufficient to include all scholarly authorships, 2) data and techniques used for detection of author’s gender need more geographic inclusions, 3) new techniques and methods should be adopted for more precise and inclusive analysis, and 4) the results, techniques and methods should be tested thoroughly from different sources of data and geographic conditions. The field is new, active, important and challenging area of research for equality and social welfare.

Keywords

Women , Science , Research , Publications , Gender , Feminism , Authorship , Authorship puzzle

1 . INTRODUCTION

Naturally, women have equal intellectual abilities to men (James and Drakich, 1993). But, women are considered unfit for intellectual activities since centuries and underrepresented in authorship in scientific publications (Bhagat, 2018). Only 30% of authorship is contributed by the women and women contributed equally to men in only 6 countries (Larivière et al., 2013). Women authorship varies from 17.0% (Japan) to 49.5% (Portugal) (Bendels et al., 2018). Women in editorial boards of different journals (1985-2013) in environmental biology, natural resource management and plant sciences are 13%, only (Cho et al., 2014).

Scholars like Cole and Zuckerman (1984) have explained productivity puzzle as: scientific abilities, self-selection, social-selection and accumulated disadvantages (Besselaar and and Sandstrom, 2016). Traditionally, scholars and society at large believes in disparity of academic abilities between men and women (Cole and Zuckerman, 1984). However, many recent studies have denied these assumptions (James and Drakich, 1993) and many women intellectuals showed path breaking intellectual contributions across the continents.

Motherly responsibilities like pregnancy, child bearing, family caring and domestic works affect the research career of women than the men. Women show lesser scientific performance in early career due to time constrains and they select lower grade career (Kyvik and Teigen, 1996; Kaufman and Chevan, 2011; Besselaar and and Sandstrom, 2016). However, some scholars have proved no relationship between parenthood and career in scientific research. Child caring and domestic works are not a ‘self-selection’ but ‘social-selection’. Discriminated social structure and traditional setup assign these responsibilities to women. Their engagements in child and family caring with social, traditional and religious functions and rituals negatively affect their education, academic performance and early career path. Therefore, women select easy way of career with lower reputations, lesser collaborations and co-author networks. Women receive less academic support and mentor than men (NRC, 2010; Duch et al., 2012). All these situations lead to accumulative disadvantages. Gender-specific quantitative analysis of authorship can be useful for gender sensitive development of any institutions (Bendels et al., 2018).

Many researchers were conducted the studies to analyze the gendered performance and found discriminated patterns of authorship. Some of them have showed smaller gender difference in field like economics and this gap disappeared in case of psychology. However, these results vary according to data, size and time length, methods and techniques, etc. selected for the analysis. Used data sources for these analyses vary from very small to large in size and from specialized to general. Detection of gender from authors’ names appeared on the journal pages is another challenging task. Gender meaning of author’s name vary according to culture, religion, region, country, etc. Representation of women is dynamically appears with socio-eco-political changes in any country and worldwide. Further, meaning of results varies with used techniques for the analysis. Therefore, this study reviews: 1) sources and size of data, and 2) methods and techniques used to analyze the representation of women in scholarly publications. This review will be helpful to assess the applicability of used data sources, methods and techniques for analysis, planning and management of women participation in authorship of scholarly publications. The field is new, active, important and challenging for authorship studies for social welfare. 

2 . AUTHORSHIP

Researchers are reporting their results and findings to scholarly society through research articles published in peer-reviewed journals (Weltzien et al., 2006). These articles are single or multiple authored. Credit conflicts rise in multiple authored articles. Only 30% authorship of scholarly articles is on the name of women with large disparity in prestigious positions: first, last, and corresponding authors (West, 2013; Mueller et al., 2016; Bendels et al., 2018; Nature, 2018). Some of the studies have reported significant difference in growth of first and senior women authorship (Liang et al., 2015; Filardo et al., 2016; Ouyang et al., 2018). Women show significantly less authorship of invited articles, editorial and articles published in high impact factor journals (Holman et al., 2018; Long et al., 2015; Bendels et al., 2018). Women authorships vary according to disciplines of STEMM and most biased disciplines show very less improvement towards the gender equality (Larivière et al., 2013; Holman et al., 2018). Thus, several scholars have reported very interpretive and significant results about underrepresentation of women in scholarly and prestigious authorship (Bhagat, 2018). Some of them are worried about continuous underrepresentation of women authorship (Cikara et al., 2012). However, most of the data used for these analyses comes from some specific region and institutions with large exclusions. The methodology and techniques used for these analyses are tested in only few case studies. Therefore, this study reviews sources, coverage, size and quality of data and methods and techniques used in reported studies.

3 . DATA

Source of data defines the field, coverage, size and quality. Identification of the author is key performance in analysis of disparity in authorship of scholarly publication and gender meaning of author’s first name vary according to intra- and extra-regional distribution of sociocultural aspects of the society. Further, arrangements of the author lists given with research documents indicate relative contribution of the listed authors and prestige varies accordingly. Therefore, the study thoroughly focuses on the analysis of sources of data used in different studies as well as information and methods of authorship identification as gender, geographic locations and author order in the list.

3.1  Sources

Data samples are representing different scientific fields, quality and size (Cole and Zuckerman, 1984). Cole and Zuckerman (1984) have used number of publications by 263 pairs of scientists (526 men and women) from astronomy, biochemistry, chemistry, earth sciences, mathematics and physics for analyse the productivity patterns. The information was collected from American Doctoral Dissertations (ADD). Stack (2004) was restricted to publications by Ph. D. scholars in five years for gender analysis. It was small dataset available at National Research Council’s 1995 Survey of Doctorate Recipients (SDR). Besselaar and Sandstrom (2016) have analyzed curriculum vitae (CV) of 400 researchers (available at Web of Science (WoS)) applied for early career grant program of a social science council in the Netherlands (2003-2005) to understand the gender difference in research performance with career progress. Kaufman and Chevan (2011) have surveyed the physical therapist to understand the gender gap in peer-reviewed publications. Printed and electronic questionnaires were circulated within sample respondent selected using stratified random sampling technique based on levels and size. Some scholars have been used table of content provided by the journals (Budden et al., 2008; Rigg et al., 2012).

Some of the scholars have been used authorship data available at institutes for gender analysis. Larivière et al. (2013) have used US Social Security database for 27329915 authorships of 5483841 research papers and review articles for analysis of women representations. Filardo et al. (2016) have collected author information of original articles of six journals for 20 years (1994-2014) to compare the contributions of female first authors in medical journals. Long et al. (2015) have collected authorship information from major gastroenterology journals (1992-2012 with five years gap) for examination of female authorships in USA.

Scopus’ database contains over 62 million documents in more than 21,500 serials from 5,000 publishers in physical sciences (6,900 titles), health sciences (6,400 titles), life sciences (4,150 titles) and social sciences (6,800 titles) (GGRL [Gender in the Global Research Landscape], 2017). Scopus gives all articles published by the author with alternative spellings of last name, together. First name is not mandatory in Scopus data base but available in author profile. This data base is used by many researchers for analysis of gender disparity in the authorship.

Some scholars have used bibliographic database from Thomson Reuter’s Web of Science (WoS) based  information available at websites and curriculum vitae (Ghiasi et al., 2015; Zeng et al., 2016). Further, PubMed and arXiv databases (15 years) were used by Holman et al. (2018) for analysis of gender gap in scientific publications (STEMM).  The data covers 36 million authors of articles published in >6000 journals from >100 countries.  West et al. (2013) have used JSTOR cropus datasets from digital archives (1990-2011) of 4.2 million research articles published in 1545 (2011) journals in science and humanities to analysis the role of gender in scholarly authorship. Macaluso et al. (2016) have used PLOS [Public Library of Science] data with Web of Science (WoS) registers for analysis of gender difference in contributors of articles (85,000) published in science and medical journals using descriptive and regression techniques. Geller et al. (2011) have used PubMed data of nine prominent journals in medical science for analysis of inclusion of sex and race in clinical trials.

Some scholars have been selected only high quality journals to understand the gender disparity in authorship of high quality research publications. Bendels et al. (2018) have used 293557 articles published Nature indexed journal (2008-2016) for analysis of 693575 authors affiliated to 185 countries. Some of them have been analysed the data of selected journals based on quality (impact factor) (Ouyang et al., 2018). Ouyang et al. (2018) have used bibliographic data of all authors from selected three high impact-factor journals in cardiology for 1980-2017.

Thus, used data varies from small to large size and low to high quality journals from different sources. The disparity in gender detection and inclusion of different fields also vary according to data source and size. Thus, the effective results are fully relied on quality of the data (Macaluso et al., 2016).  

3.2  Authorship Identification

Detection of author’s gender is very crucial part of analysis for women in authorship of scholarly articles. Many authors have been used first name for detection of gender of the authors however gender meaning of the first name of the author varies according to culture, religion, region, nation, etc. Therefore, many scholars have been considered the geographical location of the author’s origin. Further, prestige of authorship varies according to authors’ order in the list. Scholars have been analysed author’s order to detect the prestigious contribution by women in scholarly authorship.

3.2.1  Author’s Gender

Several scholars have been determined gender by inspection of author’s first name (Budden et al., 2008; Long et al., 2015; Filardo et al., 2016). Gender meanings of author name vary by culture, religion, region, nation, etc. Therefore, determining gender from first name has been challenge task before the scholars. Some of them have used personal profiles at institutional homepages, social networks, etc. for identification of author’s gender (Filardo et al., 2016). Many journals and authors are putting their names gender neutral as providing only initials, gender neutral names, etc. (Budden et al., 2008). Personal knowledge is useful only up to some extent for gender identification based on first name of the author. Therefore, many scholars have been used established databases for this purpose instead of relying on personal knowledge for robust gender detection from the authors’ names (Table 1).


Table 1. Data Sources used for identification of authors’ gender

Source

Links

Authors

US Census

https://www.census.gov/genealogy/www/data/1990surnames/names_files.html

Larivière et al. (2013); Ghiasi et al. (2015); Filardo et al. (2016)

WikiName

http://wiki.name.com/en/Baby_Names 

Ghiasi et al. (2015)

Wikipedia

http://en.wikipedia.org/wiki/Category:Given_names_by_gender

Ghiasi et al. (2015), GGRL (2017)

French

http://en.wikipedia.org/wiki/French_name

http://en.wikipedia.org/wiki/Category:French_feminine_given_names

http://en.wikipedia.org/wiki/Category:French_masculine_given_names 

Larivière et al. (2013); Ghiasi et al. (2015)

Quebec Census

http://www.rrq.gouv.qc.ca/en/enfants/Pages/banque_prenoms.aspx

Larivière et al. (2013); Ghiasi et al. (2015)

Korea

http://en.wikipedia.org/wiki/List_of_Korean_given_names

http://en.wikipedia.org/wiki/Category:Korean_given_names

Larivière et al. (2013)

Lithuania

http://en.wikipedia.org/wiki/Lithuanian_name

Larivière et al. (2013)

Persian / Iran

http://www.top-100-baby-names-search.com/baby-names-persian.html

Larivière et al. (2013)

Romania

http://en.wikipedia.org/wiki/Romanian_name

http://en.wikipedia.org/wiki/Category:Romanian_given_names

Larivière et al. (2013)

Brazil/Portugal

http://en.wikipedia.org/wiki/Brazilian_name#Brazilian_names

Larivière et al. (2013)

Serbia

http://en.wikipedia.org/wiki/Serbian_name  http://en.wikipedia.org/wiki/Slavic_names

Larivière et al. (2013)

Ukraine

http://en.wikipedia.org/wiki/Ukrainian_names  http://en.wikipedia.org/wiki/Slavic_names

http://www.top-100-baby-names-search.com/ukrainian-baby-names.html

Larivière et al. (2013)

Thailand

http://www.top-100-baby-names-search.com/thai-first-names.html

Larivière et al. (2013)

India

http://en.wikipedia.org/wiki/Category:Indian_given_names

http://www.studentsoftheworld.info/penpals/stats.php3?Pays=IND  www.pkp.in/info/downloads/India%20Baby%20Names.xls

Larivière et al. (2013)

Japab

http://en.wikipedia.org/wiki/Category:Japanese_given_names  http://en.wikipedia.org/wiki/Japanese_name

Larivière et al. (2013)

NamSor™

https://www.namsor.com/

GGRL (2017)

Genderize.io

https://genderize.io/

Topaz and Sen (2016);

GGRL (2017); Ouyang et al. (2018);

Holman et al. (2018)

World Intellectual Property Organization (WIPO)

http://www.wipo.int/edocs/pubdocs/en/wipo_pub_econstat_wp_33-tech1.zip

Fox et al. (2016);

GGRL (2017)

US Social Security Administration

http://www.ssa.gov/oact/babynames/

West et al. (2013)


GGRL (2017) has combined Scopus’ data with various data sources to identify gender of the author. They have identified country of origin and first article published. Fox et al. (2016), GGRL (2017), Ouyang et al. (2018), Holman et al. (2018), etc. have validated authors’ gender based on Genderize database of 216286 names from 79 countries and 89 languages. For non-Asian countries, gender of 97% authors can be identified with about 70% probabilities and 94% with 90% probabilities using the data available at Genderize database (Fox et al., 2016). GGRL (2017) has calculated the probability (85% confidence level) of feminine and masculine names in various countries. Further, Topaz and Sen (2016) have been used this data to detect gender of the journal editors using probability considering 1.0 [ \(P_w, P_m, P_u\) ] and calibrated as probability \(P_w\)  of being women, \( P_m\)  of being men and of being undetermined.

Sociolinguistic features of author’s first name can give information about the gender of the author (GGRL, 2017).  GGRL (2017) has been used data source, ‘NamSor™ Applied Onomastics100’ for Sociolinguistic analysis to analyze the gender. Genderize and NamSor™ databases are useful for identification of authors’ gender based on first names from western countries particularly Latin and Anglophone names (GGRL, 2017). However, these data sources are not sufficient for identification of gender based on first names from African, Arabic, or Asian countries. Similar names for men and women are in East Asian countries with high frequency make difficulties in detection of gender using first name of the authors (Holman et al., 2018).

Zeng et al. (2016) and Fox et al. (2016) have been searched undefined names at websites to detect the gender of authors and reviewers. They have used biographic information and photographs for detection and confirmation of gender (Zeng et al., 2016). Scholars like Rigg et al. (2012), Cho et al. (2014), Holman et al. (2018), etc. have been used web search engines to find gender from authors’ information at different web sources.  Rigg et al. (2012) have been used this web search technique to find the gender of author from geographic information of authors’ affiliate institutes appeared at journals websites. Holman et al. (2018) have used Google search engine to verify the computationally detected gender of author. Cho et al. (2014) have been used the internet sources to detect the gender of editorial boards members of journals in environmental sciences. But, it was very difficult to find gender after using of internet sources due to unavailability of websites and updates from authors and institutes. Therefore, scholars have excluded ambiguous names for the analysis (Holman et al., 2018).

Social networking platforms like Wikipedia also gives unambiguous information about gender of the person based on first name. Therefore, Larivière et al. (2013) and GGRL (2017) have used gender information from Wikipedia for this purpose. Larivière et al. (2013) and Macaluso et al. (2016) have reported 8.4% and 8.9% found unknown author’s names from WoS, respectively. Bendels et al. (2018) have estimated unisex (8.7) and undefined (17.1%) gender of the authors of Nature indexed journals and ignored for further analysis. It is notable that they have excluded unisex author names from 20 countries including Asian important countries like China, South Korea, Singapore, Taiwan, etc. and India for undefined names. Macaluso et al. (2016) have used full name data for detection of gender of the author based on gender assignation tables by Larivière et al. (2013). Further, some data sources like arXiv do not mandate the style of author names and many authors provides initials instead of full names. First name of author is not mandatory in Scopus data. This reduces the success rate of detecting gender of the author (Holman et al., 2018).

West et al. (2013) have used records at US Social Security Administration to determine the gender of author by first name.  They have noted many similar names of male and female and extracted 73.37% first names for detection of gender after exclusion of authors provided ambiguous names and initials.

World Intellectual Property Organization (WIPO) has prepared the world gender-name dictionary (WGND) of 6,247,039 unique pairs of names and countries using 13 different sources from 182 countries (GGRL, 2017). GGRL (2017) has been identified gender of 80% authors from their profile names (1996-2015). But, they were unable to include large data come from countries like China, India, Russian Federation and South Africa in the analysis due to unavailability.

3.2.2 Geographical Location

Several scholars have been used first name of author for detection of the gender and gender meaning of the first name of the person varies according to geographic diversity especially in culture, religion, etc. Journal specific analysis have country-wise information at own data base compiled during the manuscript submission (Fox et al., 2016). Therefore, many scholars have been used location specific information to detect the gender of authors. Fox et al. (2016) have been defined continental regions based on United Nations’ Statistical Commission (unstats.un.org). Holman et al. (2018) have been used country level information on gender inequality from United Nations Human Development Report, 2015 (http://hdr.undp.org/en/global-reports). They have used information about author affiliation to detect the countries of publication. Further, Bendels et al. (2018) also have used country specific analysis for detection of author’s gender.

3.2.3 Author Order

Author ordering symbolise relative contributions in research reported in the papers and preparation of manuscript (Zuckerman, 1968). Two patterns are observed for ordering the authors’ names (Zuckerman, 1968): 1) Alphabetical ordering: equality pattern, 2) Non-alphabetical ordering: inequality pattern. West et al. (2013) have retrieved authorship position as first, second, third, fourth, etc. It is considered that first author conducts study and last author makes possible research and manuscript without actual work (Tscharntke et al., 2007; Bendels et al., 2018). Last author of the article has special meaning like principal investigator, leader of authors’ team, etc. whereas corresponding author keep communication with journal’s editorial team and publication system during  the process. Authors listed between first and last authors are co-authors considered less important and prestigious. Further, Ouyang et al. (2018) have categorized authors as first, middle and senior based on author order in the list. Bendels et al. (2018) have analyzed first-, last- and co- authorship for estimation of gender disparities in authorship of high quality Nature indexed journals whereas Bendels et al. (2018) have avoided separate weightages for corresponding authorship. Bendels et al. (2018) have considered single author as first author.

3.3 Citations

Science Citation Index (SCI) has been used widely for analysis of representation of women authors in citation index (Cole and Zuckerman, 1984). Cole and Zuckerman (1984) have used SCI data for papers published in 2993 journals for 12 years (1968-1979) excluding citations in books. They have excluded self-citation count for analysis.

4 . TECHNIQUES

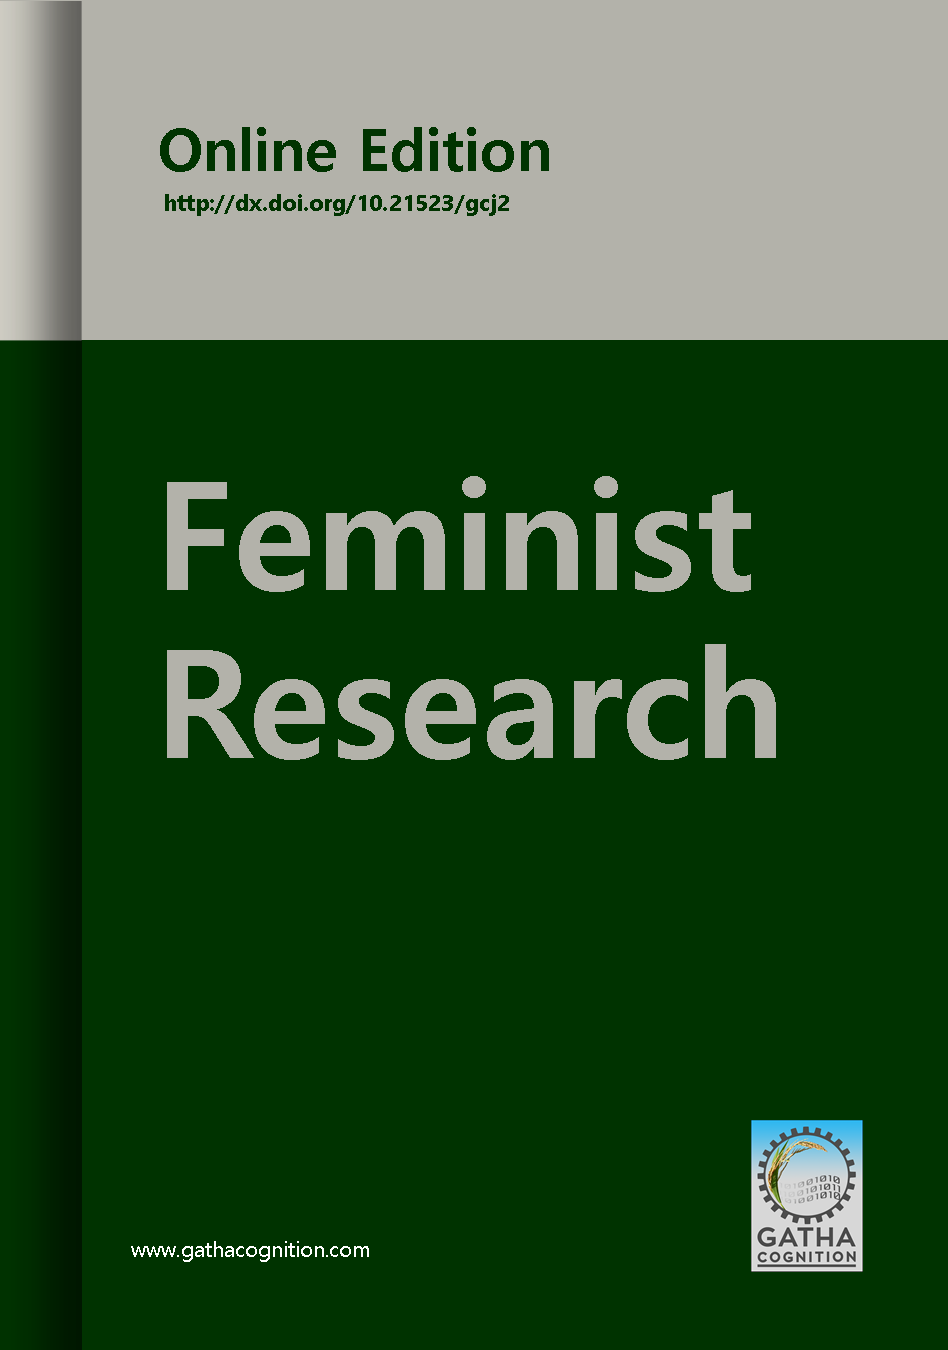
Authorship disparity has been analysed using techniques like Proportion Analysis, Gender Ratio, Female-to-Male Authorship Odds Ratio (FAOR), Linear Regression, Linear Mix Model, Prestige Index, Average Annual Growth Rates, Chi-Square Test, Z-Test, Binomial Regression Model, Collaboration analysis, Gini coefficient, Disparity Index, Actual Author Contribution of Co-authors, Normalized Citation Indicators, etc. (Table 2). Cole and Zuckerman (1984) conducted the study to indicate simple bivariate differences in research publications by gender.


Table 2. Techniques used for analysis

Technique

Description

Datasets

Authors

Remarks

Ratio analysis:

Proportion analysis

It is share of women in total authorship of scholarly articles.

Nature Index; Web of Science

Bendels et al. (2018); Holman et al. (2018)

It can measure the share of women authorship in total.


Female-to-Male Authorship Odds Ratio (FAOR)

It is ratio between share of female authorship position in total female authorship and share of male authorship in total male authorship. 

Nature Index; Web of Science

Bendels et al. (2018); Bendels et al. (2018b)

  1. It can be calculated for all first authors.
  2. At least two/three authorships require for calculation of last- and co-authors’ FAOR. 

Regression analysis:

Linear regression

---

US National Library of Medicine

Ouyang et al. (2018)

It measures the trends in authorship.

Logistic Regression Model (LRM)

Linear relationship of gender of author with parameters of publication.

Journal publication

Filardo et al. (2016)

It measures the relationship between author’s gender and publication parameters.

Linear mix model

The model fit obtained with % of women authors as the response variable.

PubMed; arXiv

Holman et al. (2018)

It estimates the share of women authorship across the positions and countries. 

Binomial Regression Model


Survey: Paper and Electronic

Kaufman and Chevan (2011)

It is useful to assess the relationship of gender with peer-reviewed articles.

Coefficients and indices:

Gini coefficient

It analyse the degree of disparity in authorship of scholarly articles.

Web of Science

Zeng et al. (2016)

It estimates degree of disparity in authorship credits within co-authors.

Disparity Index

It measures the weights of collaborations.

Web of Science

Zeng et al. (2016)

It estimates the distribution of author credits.  

Prestige Index


It indicates the holding of prestigious authorship.

Web of Science

Bendels et al. (2018); Bendels et al. (2018b)

It calculates the holding of prestige authorship and distribution with co-authors.

Relative intellectual contribution

It measures the actual contributions of collaborators in published article.


Rahman et al. (2017)

It is useful to measure the actual contribution of the collaborator to avoid bias interpretation of authorship. 

Average annual growth rates

It measures the changes in women authorship.

Web of Science

Bendels et al. (2018b)

--


4.1 Ratio Analysis

4.1.1 Proportion Analysis

Proportion of female authorship can be simply defined as ratio of female authorship to total authorship by male and female and multiplied by 100 for better readability (Equation (1)). Bendels et al. (2018) have used proportion analysis for understanding the share of female authorship of Nature indexed high quality journals. Proportion of female authorship (PFA) was calculated (Bendels et al., 2018) as:

\(PFA= {FA \over FA+MA} \times 100\)     (after Bendels et al., 2018)   (1)

\(FA\)  = female authors and \(MA\)  = male authors

PFA shows the quantitative representation of women in authorship of scholarly articles (Bendels et al., 2018)

Holman et al. (2018) have used the gender ratio for analysis of representation of women as: 1) first authors in multi-authored articles, 2) last authors in multi-authored articles, 3) authors of single authored article, and 4) overall authors- all authors of all published articles. Proportion of women authors ( P ) was calculated using logistic function (equations (2)) as:

\(P= {{e^{0.5rt}} \over {2e^{0.5rt}}+c} \)         (after Holman et al., 2018)                     (2)

where, t  is the date, r  controls the steepness of the curve and c  infliction point.  It ‘assumes that the relationship between gender ratio and time is sigmoidal and progresses monotonically either towards gender parity or the complete disappearance of one gender’ (Holman et al., 2018). This analyses the non-linear changes in gender ratio with 95% confidence level.

4.1.1 Female-to-Male Authorship Odds Ratio (FAOR)

It is ratio between share of female authorship position (first-, last-, corresponding- and other co-authors) in total female authorship and share of male authorship in total male authorship (Bendels et al., 2018). It can be calculated (equation (3)) as:

\(FAOR_{First}=FemaleOdds_{First}/MaleOdds_{First}\)           after Bendels et al. (2018)                       (3)

\(FemaleOdds_{First}=FemaleN_{First}/(FemaleN_{Co}+FemaleN_{Last})\)  

\(MaleOdds_{First}=MaleN_{First}/(MaleN_{Co}+MaleN_{Last})\)  

where, FemaleN  and MaleN  are number of female and male authorship according to types. Bendels et al. (2018) have been used this FAOR ratio analysis for prestigious authorship index analysis.

4.2 Regression Models

Scholars have been used linear regression (Ouyang et al., 2018), logistic regression model, linear mix model and binomial regression model to estimate the trends of women authorship of scholarly publications in STEMM.

4.2.1 Logistic Regression Model (LRM)

Macaluso et al. (2016) and Filardo et al. (2016) have used logistic regression model to analyse the relationship between gender and authorship type. Macaluso et al. (2016) showed significant association of gender with type of contributorship whereas Filardo et al. (2016) showed this relationship with journal’s impact and its time of publication.

4.2.2 Linear Mix Model (LMM)

Linear mix model was used to find the correlation of author ratio across the countries (Holman et al., 2018). The model (equation (4)) fit was obtained with percentage of women authors as responsive variables.

\(women \ authors \sim a_1 Position + a_2 Date + a_3 x_1+a_4 x_2+a_5 x_3+a_6 x_4+a_7 x_5+a_8 x_6+a_9 x_7+\)

\((Date/Journal)+(Date/discipline) +(Date/Country)\)      (after Holman et al., 2018)      (4)

\( x_1\) to \( x_7\) are the seven UN predictor variables, ‘date’ is date of publication, ‘position’ is authorship position (first, middle, last, single, corresponding, etc.). They have been translated in UN predictor as mean 0 and variance 1.   Here, journal is random intercept and date of publication is random slope. 

4.2.3 Binomial Regression Model (BRM)

Negative binomial regression (BRM) model was used to examine the effects of gender on peer-reviewed articles publication (Kaufman and Chevan, 2011). Poisson model showed over dispersion for count data (Kaufman and Chevan, 2011)

4.3 Coefficients and Indices

4.3.1Gini Coefficient

Scholars have used Gini Coefficient by Gini (1912) to measure the degree of inequalities in statistical distributions derived from Lorenz curves (Ultsch and Lötsch, 2017). Zeng et al. (2016) have used this Gini coefficient (equation (5)) to understand the statistical distribution of authorship credits within the co-authors. It measures the degree of inequalities in the distribution of authorship credits.  

\(G(a)= {2 \sum^{n_{c}}_{i=1} iy_i \over n_c \sum^{n_{c}}_{i=1} iy_i} - {n_c+1\over n_c}\)        (after Zeng et al., 2016) (5)

Here, \(a\)  is author and \(n_c\)  are co-authors. Zeng et al. (2016) have counted times of collaboration between \(a\)  and \(c_i\) , \(y_i\) . \(y_i\)  is next arrange in non-decreasing order as \(y_i \leq y_{i+1}\). Further, Chien et al. (2018) have used this coefficient to analyse the author’s research domain and ordering the author names on scholarly articles.  

4.3.2 Prestige Index

Prestige index (PI) can indicate holding of prestigious authorship (first and last authorships) by women compared to men (Bendels et al., 2018; Bendels et al., 2018a). It is prestige-weighted average (equation (6)) of the \(FAOR_{excess ε_t}\)  calculated for all authorship types:

  \(ε_t=w_t (FAOR_t-1)\) , if \(FAOR_t≥\) , otherwise \(ε_t=w_t (1-1/FAOR_t)\)  (after Bendels et al., 2018a)

         (6)

\(w_t\)  is weighting factor,  t  is authorship types.  Bendels et al. (2018a) have been weighted co-authors negatively ( \(w_{co}=-1\) ) and first and last authors positively as \(w_{first} = w_{last} = 1\) . Estimated PI value is ‘0’ indicating balanced prestigious authorship between women and men whereas values more than ‘0’ show excess and less lack of prestigious authorship hold by women. Higher FAOR for first and last authors increases PI and middle authors (co-authors) show less PI.  Bendels et al., (2018) have been excluded the alphabetically arranged authors for PI analysis.

4.3.3 Disparity Index

Zeng et al. (2016) have been calculated the weights of collaboration between \(a\)  and \(c_i\)  (equation (7)):

\(W_{ac_i }=∑^{k_{c_i}}_{j=1} {1\over l_j-1}\)     (after Zeng et al., 2016)             (7)

\(k _ {c_i}\)  is the number of publication by \(a\)  and \(c_i\)  together and \(l_j\)  is the number of co-authors of publication j . Further they have calculated the total weights of collaborations for author, \(a\)  (equation (8)).

  \(S_a=∑^{n_c}_{i=1} W_{ac_i} \)    (after Zeng et al., 2016)         (8)

Finally disparity index was calculated (equation (9)) as:

  \(\gamma (a)=∑^{n_c}_{i=1} ({W_{ac_i} \over S_a})^2n_c\)       (after Zeng et al., 2016)    (9)

Ouyang et al. (2018) have used Mann-Whitney U test and χ2 test to determine significant differences between male and female authors.

4.4 Normalized Citation Indicators

Besselaar and Sandstrom (2016) have field normalized citation indicators to analyze the gender difference in research performance in relation to career progress as:

P: Number of publications, full counting

Frac P: Number of publications, fractional counting based on author shares

NCSf: Field normalized citation score, e.g.  2014

NCSf2y: Field normalized citation score, year window e.g. 2 years

TOP x %: Share of publications in the set of (1, 5, 10, 25 and 50 %) highest cite publications, field normalized

4.5 Collaboration Analysis

Zeng et al. (2016) have used Gini coefficient and disparity index to measure the homogeneity of author collaboration to understand the collaboration opportunities for women authors. Higher Gini Coefficient or disparity index indicates the inhomogeneity of collaboration with meaning that author collaborates with small portion of his/her co-authors and only few attempts with remaining majority of co-authors. Thus, this author has high propensity to collaborate with few co-authors only.

4.6 Actual Contribution of Multiple Authors

Macaluso et al. (2016) and Rahman et al. (2017) have suggested for replacing the authorship with contributorship to illuminate the potential disparities within authors of scholarly publications. Rahman et al. (2017) have been classified author contribution into three groups: 1) Intellectual activities (IA), 2) Logistics support (LS) and 3) IA and LS combined. IA includes initiation of research proposal, review of literature, designing research methodology, technical guidance, instrumental setup, data collection, data analysis and interpretation, writing the manuscript, revisions, etc. Language editing, laboratory facilities and data collection are LS for conducting research project and preparing manuscript. They have suggested relative weights (0 to 1) to identify contribution of each author for each activity ( \( IC^a_i\) ). Relative intellectual contribution for each author ( \( IC^r_i\) ) can be calculated using following equation (equation (10)):

  \(IC^r=∑^{n}_{i=1} WF_i \times IC^a_i \)       (10)         (after Rahman et al., 2017))

where, n  is the number of different activities, \( IC^a_i\)  is the value of intellectual contribution of each author for each activity i ,  \(WF_i\)  is the weights of intellectual activity i . They have calculated equal weighing of all intellectual activities, different weights for an intellectual activity in different papers and equal weight for multiple intellectual activities. The method will be helpful to calculate actual contribution of each author instead of traditional vague biased method of calculating author contributions. It will remove the misappropriation of authorship credits and misconduct in scientific community (Macaluso et al., 2016).

4.7 Average Annual Growth Rates

Bendels et al. (2018a) have calculated average annual growth rate for PFA [female authorship], FAOR and Prestige Index to understand the temporal development.

4.8 Significance Tests

Budden et al. (2008) have been used ‘Chi-square’ and ‘Z-test’ to analyse the representation of male, female and unknown first author.


5 . CONCLUSIONS

Women are underrepresented in authorship of scholarly articles published in Science, Technology, Engineering, Mathematics and Medicine (STEMM). The scholars have been analysed this representation of women using wide range of data, methods and techniques. Several studies have reported complementary results showing gender disparity in authorship of scholarly publications. However, the reported results vary according to objectives of the study, size and source of the data, techniques and methods used for the analysis. Therefore, these results are specific to size and source of data, techniques and methods, academic fields, journals, regions, etc. and insufficient to reach global conclusions. The study concludes that: 1) available data is insufficient to include all scholarly authorships, 2) data and techniques used for detection of author’s gender need more geographic inclusions, 3) new techniques and methods should be adopted for more precise and inclusive analysis, and 4) the results, techniques and methods should be tested thoroughly from different sources of data and geographic conditions. The field is new, active, important and challenging area of research for equality and social welfare.

Conflict of Interest

The author confirms that the content in this article has no conflict of interest.

Acknowledgements

Author is thankful to anonymous reviewers for constructive comments and suggestions on the manuscript.

Abbreviations

ADD: American Doctoral Dissertations; CV: Curriculum Vitae; EASE: European Association of Science Editors; EC: Equal Contribution; FAOR: Female-to-Male Authorship Odds Ratio; GGRL: Gender in the Global Research Landscape; LRM: Logistic Regression Model; NRC: National Research Council; PCI: Percent-Contribution-Indicated; PFA: Proportion of Female Authorship; PLOS: Public Library of Science;  QUAD: Quantitative Uniform Authorship Declaration; SAGER: Sex and Gender Equity in Research; SCI: Science Citation Index; SDC: Sequence-Determines-Credit; SDR: Survey of Doctorate Recipients; STEMM: Science, Technology, Engineering, Mathematics and Medicine; WIPO: World Intellectual Property Organization; WoS: Web of Science.

References

9.

Cole, S. and Zuckerman, H., 1984. The productivity puzzle: Persistence and change in patterns of publication of men and women scientists. Advances in Motivation and Achievement, 2, 217-258.

23.

Macaluso, B., Larivière, V., Sugimoto, T., Sugimoto, C., 2016. Is science built on the shoulders of women? A study of gender differences in contributorship. Academic Medicine, 91(8), 1136-1142.

37.

Zuckerman, H., 1968. Patterns of name ordering among authors of scientific papers: A study of social symbolism and its ambiguity. American Journal of Sociology, 276-291.